
I. Introduction
1Greenhouse gases (GHGs) from human activity are blamed for global temperature rise that is beginning to cause climate change that may make the earth uninhabitable. However, it should be noted that natural GHGs, including carbon dioxide (CO2), normally present in the atmosphere before the dawn of the industrial age, made the earth habitable. It is the release of additional GHGs, mainly CO2, arising as a by-product of the industrial revolution that began around 1750, that is causing the global temperature rise. Much of this GHG release in the past 150 years has been from burning fossil fuels and agricultural practices. As manufacturing processes become more sophisticated, such as those for the manufacture of electronics and solar panels for CO2-free electricity generation, recent novel man-made GHGs with much greater global warming potential than CO2 are being emitted, raising serious concerns.
In this report, the role of naturally occurring GHGs and the global temperature rise of the past 150 years from GHGs released mainly from fossil fuel use are briefly reviewed. The potential future impact of the release of novel GHGs being used in manufacturing processes is also noted.
II. Earth’s Energy Balance and Effect of GHGs
The earth would be cold and likely devoid of life forms were it not for the energy emitted by the sun that reaches it. The sun puts out 1370 watts of energy per square meter (w/sq-m). Using the earth’s surface area exposed to the sun, one can show that the sun’s energy falling on the earth is approximately 175 quadrillion2 watts or 175 million gigawatts of power. However, earth reflects much of it back into space. Using two key laws of physics 3 to account for energy reflected, absorbed and reradiated, we can show that the earth’s surface temperature should be at -18 0C. While this temperature may allow some life forms, it would be hard for us humans to survive.
Natural greenhouse gases, water vapor and a small amount of CO2 present in the atmosphere came to our rescue by trapping heat to raise the temperature– nitrogen and oxygen present in the atmosphere do not trap heat. The water vapor raises the temperature by about 30 0C and the CO2 present naturally (approximately 280 ppm before the industrial age) adds another 2-3 0C, holding the average global surface temperature at about 15 0C.
However, human-caused emission of greenhouse gases into the atmosphere since the dawn of the industrial age has trapped additional heat (denoted as radiative forcing) in the atmosphere, raising the global temperature. These impactful GHGs reached yearly values of 410 ppm for CO2, 1866 ppb for methane, and 332 ppb for Nitrous Oxide (N2O) in 20194. CO2 addition has come mainly from use of fossil fuels for power (coal, petroleum and natural gas-methane (CH4), with coal being the most potent contributor,) and petroleum use in automobiles. Methane and N2O release arise from agricultural practices. There is some methane release from petroleum production as well.
III. Global Temperature Rise- Latest IPCC report
Well over a hundred years back, researchers had predicted5 the potential for global temperature rise from emission of GHGs, mainly CO2. However, not much attention was paid until the 1970s when the global temperature rise from human activities began to alarm the world. In 1988, governments came together at the UN to establish the Intergovernmental Panel on Climate Change (IPCC) to review and enhance climate science for action. The work of the IPCC over the years has strengthened our understanding of climate science. This led to the 2015 UN Framework Convention on Climate Change (UNFCCC), known as the Paris Climate treaty, to hold the global temperature rise to below 2 0C, preferably below 1.5 0C, to avoid catastrophic climate change. The IPCC has three working groups, WGI-Physical Science Basis, WGII- Impacts, Adaptation and Vulnerability, and WGIII- Mitigation of Climate Change. A large number of scientists from around the world participate in these Working Groups and in preparing their reports.
The IPCC Working Groups periodically update their assessments. Working Group I (WGI), finalized its sixth assessment (AR6), Climate Change 2021: The Physical Science Basis, on August 6, 2021. This assessment updates the science behind climate change, past, present, and future. The report’s contents were released in three main formats: Summary for Policy Makers (SPM), Full Report (3949 pages), and Headline Statements. One of the Contributing Authors to this update was from Bangladesh.
The broad findings in the WGI AR6 report are the following:
- The global temperature rise is clear and the human influence in this rise is unequivocal.
- The scale of recent changes across the climate system, as a whole, is unprecedented over many centuries to many thousands of years.
- Human-induced climate change is already affecting many weather and climate extremes in every region across the globe.
However, a detailed look indicates that the confidence level on human causes of these outcomes is not uniform across them. For example, as discussed in a later newsletter item, the confidence level (on human causes of) extreme precipitation and agricultural/ecological drought are much less than the confidence levels on extreme heat, across regions.
Figure 1 adopted from the WGI AR6 report, displays the changes in global surface temperature relative to 1850-1900. This is the earliest period with sufficiently complete observations to estimate global surface temperature. It is consistent with the previous assessment, AR5 on WGI.
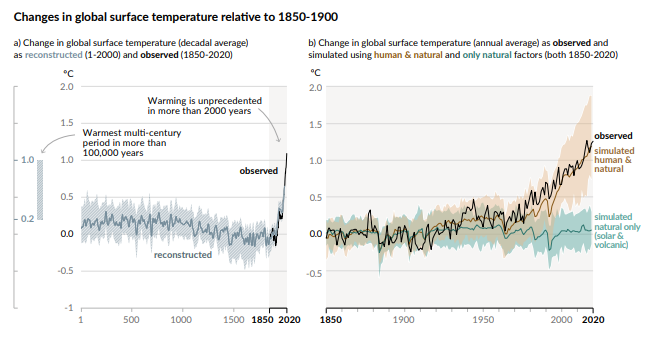
Figure 1. History of global temperature change (Figure SPM.1 adopted from Summary for Policy Makers)
The left panel in Figure 1 displays the reconstructed temperature until 1850 and the observed temperature between 1850 and 2020. The reconstruction is done using paleoclimate archives (yr. 1-2000) utilizing climate models and data from ice cores. The figure successively notes a previous warmest multi-century period of 1 0C change, a relatively stable period of about 1- 900 AD with a change of about 0.25 0C, followed by a global cooling period 900 AD-1500 AD, then a relatively stable period until about 1800. The temperature is then observed to rise rapidly and appears to have risen by more than 1 0C. In fact, the report notes that relative to 1850-1900, the global temperature rise was 0.99 0C. In 2011-2020, it was 1.09 0C (9.5- 1.20 C). The shading shows the very likely (90-100% probability) ranges for the temperature reconstructions.
The right panel in Figure 1 depicts an expanded display of the observed temperature profile, the simulated natural only cause (solar and volcanic) and simulated human and natural causes combined. Solid colored lines show the multi-model average, and colored shades show the very likely range of simulations. It should be noted that the latter shows a very close match to the observed temperature profile, adding confidence to the simulation. The likely (66-100% probability) range of total human-caused global surface temperature increase from 1850–1900 to 2010–2019 is 0.8°C to 1.3°C, with a best estimate of 1.07°C.
IV. Impact of GHG Emission on Global Temperature Rise Since 1750.
As predicted by Arrenius6 and others, the global temperature rise noted above came from emission of GHGs from human activity since the dawn of the industrial age. Scientists use a term radiative forcing (RF) of the atmosphere that is the net energy gained (by the atmosphere) due to the heat trapped by GHGs. Assuming an RF of zero in year 1750, with the CO2-equivalent in the atmosphere at approximately 280 ppm, they estimated that a 475 ppm CO2-equivalent corresponding to an RF of 2.6 watts/sq-m) would result in a 1°C rise in global average temperature. Well-mixed green-house gas amounts have continued to rise since 1750, reaching yearly values of 410 ppm for CO2, 1866 ppb for methane, and 332 ppb for N2O, in 2019.
These gases have different global warming potential (GWP). Relative to the 100-year GWP (denoted as GWP-100) of 1 for CO2, methane (CH4) that arises from soil, cows, farming, and natural gas production has a (100-yr) GWP of 84. N2O released mainly from agriculture (soil fertilization) and also as a byproduct of fuel combustion and industrial processes has a corresponding GWP of 273. In a crude approximation, considering a composite GWP of the three gases, the 1.07 degree C average global temperature rise shown in Figure 1 appears to be on target.
V. Potential for Future GHG Emission and Global Temperature Rise.
(i) Core GHGs: We noted above the amounts of three key human-caused GHGs, CO2 methane, and N2O, in 2019. According to the IPCC WGI Ar6 report, their increases from 2011 were 19 ppm for CO2, 63 ppb for CH4 and 8 ppb for N2O. This increase continues. For example, according to data from Hawaii’s Mona Loa Observatory, the CO2 inventory was at almost 417 ppm by July 2021. Their unabated emission would continue to cause an increase in the global average temperature. It is estimated that GHG concentration at 800 ppm CO2-equivalent would add to the forcing function of 4.5 and lead to a temperature rise of 2.2 °C. At 1,313 ppm reflecting no mitigation, the temperature rise would be 3.7 °C. Both scenarios would most likely cause major changes in the global climate that could result in significant increases in extreme weather events and rising sea levels.
(ii) High-GWP Gases: There are several manmade GHGs used in industrial processing that have a much higher GWP than CO2. These include hydrofluorocarbons (HFCs), perfluorocarbons (PFCs), and sulfur hexafluoride (SF6), and nitrogen trifluoride (NF3). HFCs are used as refrigerants, aerosols, and solvents, PFCs are used to make fluoropolymer coatings and products that resist heat, oil, stains, grease, and water, and SF6 is used in several electrical transmission and distribution systems. NF3 is finding increasing use in manufacturing of flat-panel displays, solar photovoltaics, LEDs and other microelectronics. According to the IPCC WGI Ar6, the GWP-100 of HFC’s could be as high as 14,200 for HFC-23 and 3,740 for HFC-125. The GWP-100 for SF6 and NF3 are 25,200 and 17,400, respectively.
The amount of most of these high-GWP gases in the atmosphere are still small. Their 2019 atmospheric inventories were: HFCs (237 ppt7 HFC-134a equivalent); PFCs (109 ppt CF4 equivalent); SF6 (10 ppt); NF3 (2.05 ppt). In view of their small inventory, the effective radiative forcing function of these high-GWP gases contributing to global temperature rise is still small. However, their amounts are increasing. For example, between 2011-2019, HFC-125 increased by 187%, SF6 increased by 36% and NF3 increased by 147%. Alternatives to SF6 have been developed, but it remains in wide use. With rapidly growing PV and electronic markets, the atmospheric inventory of NF3 and hence its forcing function contribution can grow at a rapid rate. So over time, alternatives will have to be explored.
The IPCC report reiterates a definite global temperature rise and relates it even more clearly than previously to human-caused GHG emission. The close match of the simulation-predicted increase with observed data largely invalidates the skepticism of climate change deniers about climate models. The report, however, cautions us about even more potent (high GWP) human-developed GHGs used increasingly in industrial processing including the manufacture of computer chips and solar PV for renewable energy generation.
Dr. Ahmed Badruzzaman, a nuclear physicist by education, has spent over 40 years studying multiple energy technologies and related issues at various US organizations. He is a professional faculty at Haas School of Business in University of California, Berkeley and chairs the BEN Energy Panel. He is an SME Consultant to the US Department of Energy.
- This article is based on the course, Energy and Civilization, that the author co-teaches at the University of California, Berkeley.
- 1 quadrillion = 1015
- The law of energy conservation and the Stefan-Boltzmann (SB) law, The SB law relates energy radiated from a blackbody surface to the quadratic power of the temperature on its surface.
- ppm = parts per million, ppb=parts per billion
- In 1856, American scientist, Eunice Foote, in a paper had noted the enormous potential of CO2 to trap heat. In 1896, Swedish chemist Savente Arrenius predicted that doubling of the CO2 concentration in the air would raise the earth’s surface temperature by about 4 0C . Arrenius went on to win a Nobel Prize in Chemistry in 1903. In a 1908 paper, he decried the role of coal combustion in generating the CO2.
- Arrhenius, S. (1896) On the Influence of Carbonic Acid in the Air upon the Temperature of the Ground. Philosophical Magazine, 41, 237-276.
- ppt= parts per trillion
